1.mysql主从延迟
对于MySQL原生主从复制,可以毫不夸张的说,它是大多数MySQL高可用方案的基础,MHA,MMM等等都是基于原生复制。但是mysql原生复制一直以来有个诟病就是复制延时,这是一个困扰MySQL DBA多年的问题,官方提出了并行复制的解决方案,业界也搞出了galera cluster来解决延时问题()。
关于主备延时,怎么理解?问十个人有十个人的理解,并没有一个既定的俗成的定义给主备延时。首先我们来看看官网文档的解释:
Seconds_Behind_Master: The number of seconds that the slave SQL thread is behind processing
the master binary log. A high number (or an increasing one) can indicate that the slave is unable to
handle events from the master in a timely fashion
翻译过来大概意思就是从库的SQL线程来不及执行主库发送过来的binlog。mysql主备环境下,主备同步过程如下,主库更新产生binlog, 备库io线程获取主库binlog在备库生成relay log。备库sql线程执行relay log从而保持和主库同步。理论上讲主库有更新时,备库都存在延迟,且延迟时间为备库执行时间+网络传输时间。一般主从会做读写分离,如果你一点也不能接受延迟带来的影响,那么请到主库读取,从库不可能实时百分子百追上主库,这个延时可大可小,多少都是有的。
下面我们来看一个真是的主从延时例子,我首先停掉sql_thread,然后断开io_thread。
主库:
root@localhost [(none)] 03:45:42>>>show master status \G
*************************** 1. row ***************************
             File: mysql-bin.000045
         Position: 18944892
     Binlog_Do_DB:
 Binlog_Ignore_DB:
Executed_Gtid_Set: 3cbbee25-827c-11e6-b11b-0800276f0c66:1-64429,
f95dd499-827c-11e6-aaea-080027e92059:1
1 row in set (0.00 sec)
备库:
root@localhost [(none)] 03:45:46>>>show slave status\G
*************************** 1. row ***************************
               Slave_IO_State:
                  Master_Host: 192.168.56.103
                  Master_User: repl
                  Master_Port: 3306
                Connect_Retry: 60
              Master_Log_File: mysql-bin.000045
          Read_Master_Log_Pos: 9472697
               Relay_Log_File: mysql-relay-bin.000002
                Relay_Log_Pos: 675
        Relay_Master_Log_File: mysql-bin.000045
             Slave_IO_Running: No
            Slave_SQL_Running: No
              Replicate_Do_DB:
          Replicate_Ignore_DB:
           Replicate_Do_Table:
       Replicate_Ignore_Table:
      Replicate_Wild_Do_Table:
  Replicate_Wild_Ignore_Table:
                   Last_Errno: 0
                   Last_Error:
                 Skip_Counter: 0
          Exec_Master_Log_Pos: 502
              Relay_Log_Space: 9473077
              Until_Condition: None
               Until_Log_File:
                Until_Log_Pos: 0
           Master_SSL_Allowed: No
           Master_SSL_CA_File:
           Master_SSL_CA_Path:
              Master_SSL_Cert:
            Master_SSL_Cipher:
               Master_SSL_Key:
        Seconds_Behind_Master: NULL
Master_SSL_Verify_Server_Cert: No
                Last_IO_Errno: 0
                Last_IO_Error:
               Last_SQL_Errno: 0
               Last_SQL_Error:
  Replicate_Ignore_Server_Ids:
             Master_Server_Id: 11
                  Master_UUID: 3cbbee25-827c-11e6-b11b-0800276f0c66
             Master_Info_File: mysql.slave_master_info
                    SQL_Delay: 0
          SQL_Remaining_Delay: NULL
      Slave_SQL_Running_State:
           Master_Retry_Count: 86400
                  Master_Bind:
      Last_IO_Error_Timestamp:
     Last_SQL_Error_Timestamp:
               Master_SSL_Crl:
           Master_SSL_Crlpath:
           Retrieved_Gtid_Set: 3cbbee25-827c-11e6-b11b-0800276f0c66:64227-64328
            Executed_Gtid_Set: 3cbbee25-827c-11e6-b11b-0800276f0c66:1-64227,
f95dd499-827c-11e6-aaea-080027e92059:1
                Auto_Position: 1
         Replicate_Rewrite_DB:
                 Channel_Name:
           Master_TLS_Version:
1 row in set (0.00 sec)
几个重点位置对应关系如下图所示:
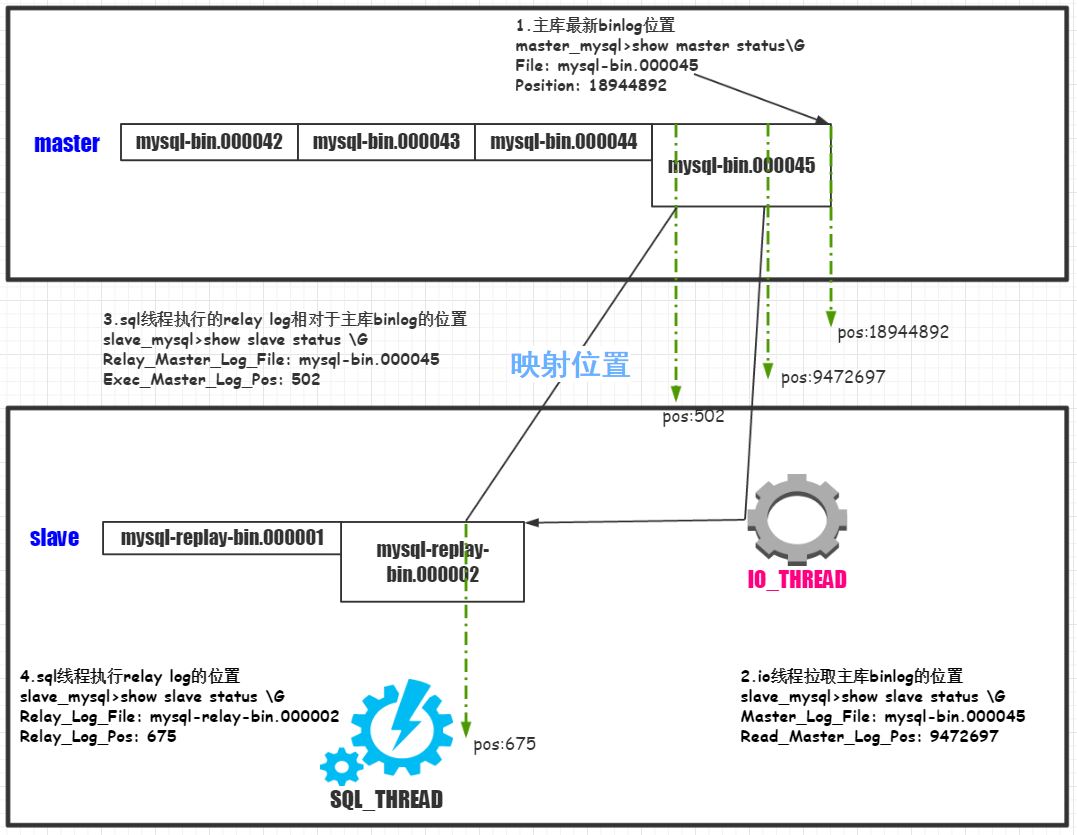
那么我们从那里看主备延时呢?首先我们可以从官方原生支持的Seconds_Behind_Master状态量查看。但是我们在生产环境中一般不使用该状态量作为主备延迟参考,主要原因请参考博文(https://yq.aliyun.com/articles/11032),该文从源码层面解释为何Seconds_Behind_Master不是那么可靠。从上面的demo也可以看出,Seconds_Behind_Master居然为null,shit。
2.主流主备延时监控
既然Seconds_Behind_Master不是那么可靠,我们得想个靠谱的方案啊。这时我们可以借鉴下oracle active dataguard主备延时计算的算法,adg的延时计算大概是这么干的,dataguard是基于redo的物理复制,玩过oracle的朋友肯定知道oracle中有个scn(有兴趣可以自行研究下oracle的SCN),scn和时间可以相互转化,这就简单了,主备之间的scn稍微转换下,再一减不就得了,还是很准的哦。因为SCN把数据库当前执行的事务和时间扯到一起了,借着这个思想,我们可以在mysql中模仿出来,不搞那么高大上的SCN,我们只搞最简单的时间戳来模拟。
主要思想如下:
1.在test数据库中定义一张表heartbeat,只含有一列,字段类型为时间戳
2.主库中通过event每隔一秒,更新表heartbeat中的时间戳字段
3.更新操作被放入binlog中
4.备库拉取主库binlog,备库重放binlog,备库中表heartbeat的时间戳字段也会随之更新
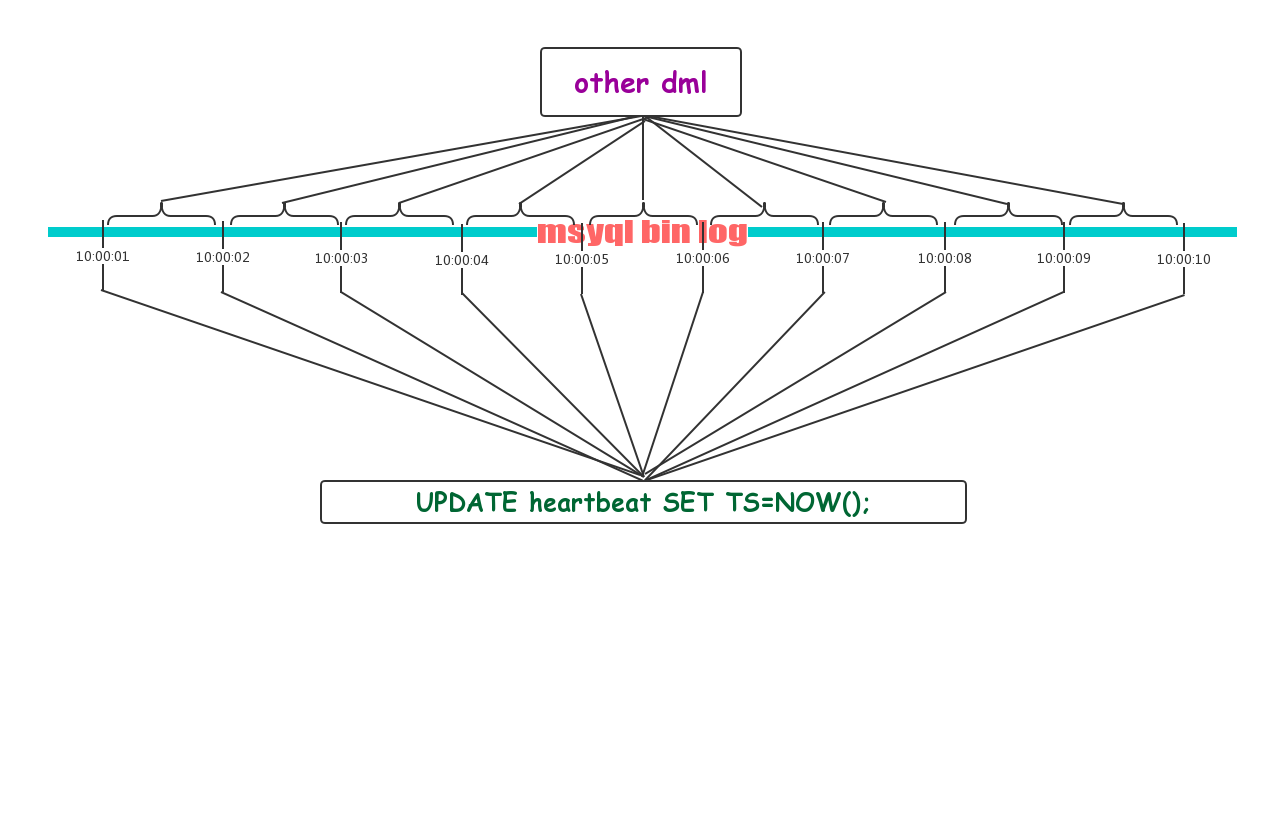
5.我们再获取备库当前时间,将当前时间与表T中的时间戳字段相减,得出时间差。
那么binlog中就是这样的,每隔一秒左右(并不百分百准确)就穿插着对表T的更新。这样得出的时间差就是备库当前重放的日志在主库执行时间相对于当前时间的差值,也就是主备延时的差值,比如主库在10:00:01对某表PPP执行了更新操作,备库却在11:00:01才重放该条binlog event,那么主备数据延迟就是一个小时。
实现起来也非常简单,首先准备主备环境(略)
一.主库准备
/*主库创建心跳表*/
CREATE TABLE heartbeat (
ts datetime NOT NULL
);
/*存储过程更新心跳表*/
DELIMITER &&
CREATE  PROCEDURE  update_curr_ts()
BEGIN
UPDATE heartbeat SET TS=NOW();
END &&
DELIMITER ;
/*写个event每秒更新一次心跳表*/
DELIMITER $$
CREATE EVENT IF NOT EXISTS e_blog
ON SCHEDULE EVERY 1 SECOND
ON COMPLETION PRESERVE
DO BEGIN
CALL update_curr_ts();
END$$
DELIMITER ;
/*启用event*/
ALTER EVENT e_blog ON COMPLETION PRESERVE enable;
/*event_scheduler*/
root@localhost [(none)] 06:15:58>>>select @@global.event_scheduler;
+--------------------------+
| @@global.event_scheduler |
+--------------------------+
| ON                       |
+--------------------------+
1 row in set (0.00 sec)
二.备库写个脚本定时查看时差即可
#!/bin/bash
#just for slave
MYSQL_PATH=/u01/app/percona-server-5.7.13-6/bin
MYSQL_HOME=/home/mysql

$MYSQL_PATH/mysql -uroot -p111111 -h192.168.56.103 -P3308 -e "select timestampdiff(SECOND,ts,NOW()) from test.heartbeat;" >$MYSQL_HOME/heartbeat.txt
布上crontab,采集时差
[mysql@hpc02 ~]$ crontab -l
* * * * * sh /home/mysql/script/check_slave.sh
3.pt-heartbeat
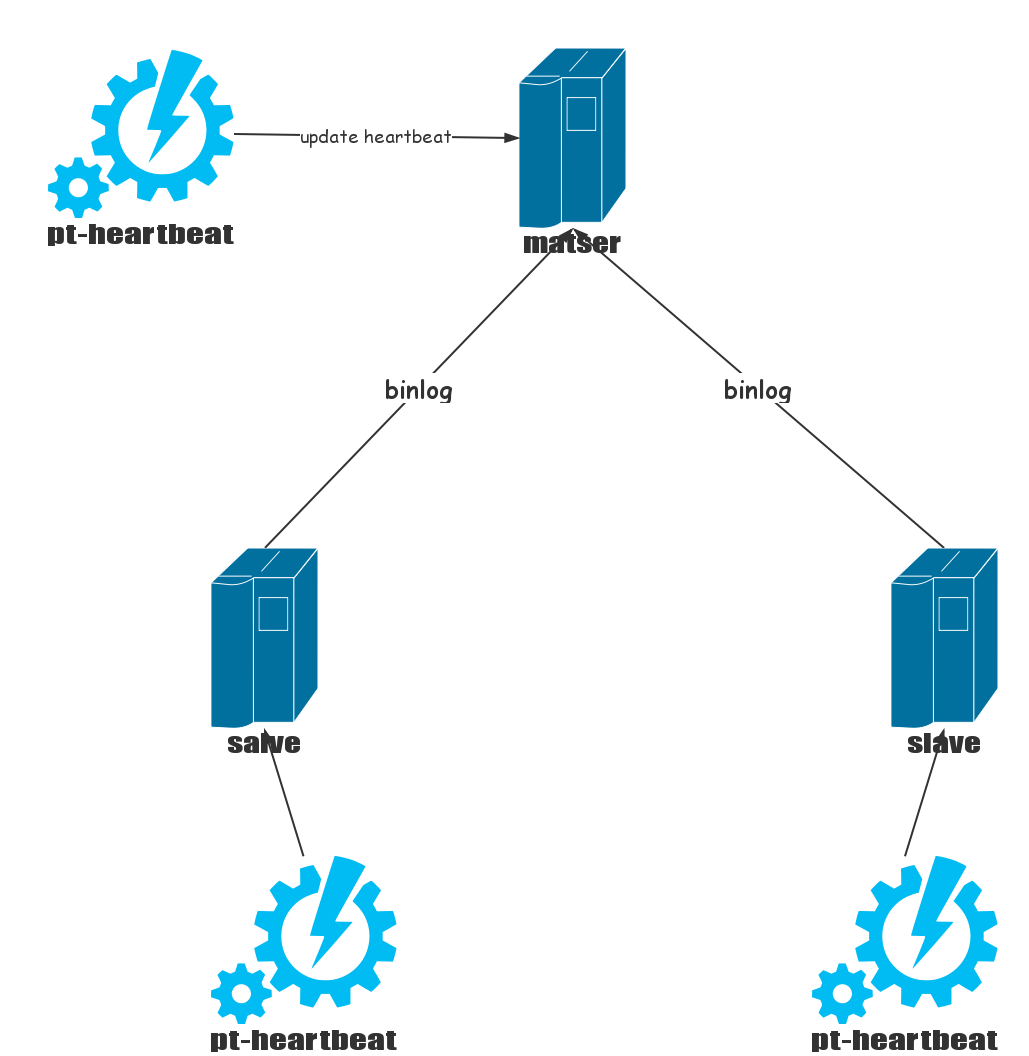
好了,扯了这么久了,pt-heartbeat这个猪脚该出场了。pt-heartbeat是什么东东呢,pt-heartbeat所做的事情把上面我的那一大堆工作全部干了,而且还支持pg,是不是很赞。pt-heartbeat的原理和上面我实现的基本一致,只是pt-heartbeat是用的程序定时去更新表中记录。pt-heartbeat包含两部分,第一部分在主库不断更新记录,第二部分在备库不断检测延时。
原理非常简单,下面我们直接给出常用的配置文件即可。
1.主库配置文件
[mysql@hpc02 ~]$ cat heartbeat_master.cnf
#DNS#
host=192.168.56.103
user=root
password=111111
port=3306

#GENERAL#
charset=UTF8
check-read-only
create-table
daemonize
interval=1
database=test
table=heartbeat
update
log=/home/mysql/heartbeat_master.log
后台运行
shell> pt-heartbeat –config heartbeat_master.cnf
2.从库配置文件
[mysql@hpc02 ~]$ cat heartbeat_slave.cnf
#DNS#
host=192.168.56.103
user=root
password=111111
port=3308

#GENERAL#
charset=UTF8
check-read-only
daemonize
file=/home/mysql/heartbeat_monitor.log
frames=1m,10m,30m
log=/home/mysql/heartbeat_slave.log
master-server-id=11
monitor
print-master-server-id
interval=1
database=test
后台运行就好了:
shell> pt-heartbeat –config heartbeat_slave.sh
直接在/home/mysql/heartbeat_monitor.log查看准备延时。

优秀啊